Thursday, April 30, 2015

Security Compliance Standard


In my future career role of an Information Security Manager, I aspire to work in the field of Information Security Management. My responsibilities will include coordinating and executing security policies and controls, as well as assessing vulnerabilities within the company. I will also be responsible for data and network security, security systems management, and security violation investigation. One of the framework that closely relates to these is the international standard of ISO/IEC 27001.

What is ISO/IEC 27001?
ISO/IEC 27001 is the best-known standard in the family providing requirements for an information security management system (ISMS). An ISMS is a systematic approach to managing sensitive company information so that it remains secure. It includes people, processes and IT systems by applying a risk management process. It can help small, medium and large businesses in any sector to keep information assets secure.

How is it useful?

More and more organizations today are embracing online opportunities to promote their business and establish their position in the marketplace through the use of mobile devices and apps, not to mention social networking sites. While doing so, these companies are greatly increasing the number and sophistication of threats targeted at them. Today's companies have no choice but to protect themselves by implementing the ISO/IEC 27001 standard.
ISO/IEC 27001 provides a management framework for assessing and treating risks, whether cyber-oriented or otherwise, that can damage business, governments, and even the fabric of a country's national infrastructure.

How will it impact my role?
As an Information Security Manager, my chief responsibility will be establishing, implementing and continually improving the information security management system (ISMS) and act as an interface between the top management and the operational business areas. Knowledge about the key elements of the ISO/IEC 27001 standard will help me to correctly interpret and implement security measures in a practice oriented manner. The compliance of ISO/IEC 27001 will help me achieve the following tasks:

Technical:
·         Approve appropriate methods for the protection of mobile devices, computer networks and other communication channels
·         Propose authentication methods, password policy, encryption methods, etc.
·         Define required security features of Internet services
·         Define principles for secure development of information systems
·         Review logs of user activities in order to recognize suspicious behavior

Communication:
·         Define which type of communication channels are acceptable and which are not
·         Prepare communication equipment to be used in case of an emergency / disaster

Human resources management:
·         Perform background verification checks of job candidates
·         Prepare the training and awareness plan for information security
·         Perform continuous activities related to awareness raising
·         Performing induction training on security topics for new employees
·         Propose disciplinary actions against employees who performed the security breach

Relationship with top management:
·         Communicate the benefits of information security
·         Propose information security objectives and security improvements/corrective actions
·         Report on the results of measuring
·         Propose budget and other required resources for protecting the information
·         Notify top management about the main risks
·         Advise top executives on all security matters

Risk management:
·         Teach employees how to perform risk assessment
·         Propose the selection of safeguards
·         Propose the deadlines for safeguards implementation

Asset management:
·         Maintain an inventory of all important information assets
·         Delete the records that are not needed any more
·         Dispose of media and equipment no longer in use, in a secure way

Incident management:
·         Receive information about security incidents
·         Coordinate response to security incidents
·         Prepare evidence for legal action following an incident
·         Analyze incidents in order to prevent their recurrence

Business continuity:
·         Coordinate the business impact analysis process and the creation of response plans
·         Coordinate exercising and testing
·         Perform post-incident review of the recovery plans

Conclusion
For me to be an efficient Information Security Manager, it is imperative that I know what constitutes a security compliance standard and how to implement it in an organization. ISO/IEC 27001 is one such comprehensive security standard that will help both me and my company to maintain the confidentiality, integrity and availability of all our information and assets, as well as, protect against any potential cyber-attacks.

Sources:

http://www.iso.org/iso/home/standards/management-standards/iso27001.htm
http://www.itgovernance.co.uk

Wednesday, April 1, 2015

Moore’s Law and Data Warehouse

Gordon Moore, founder of Intel, made an observation in 1965 which stated that the number of transistors per square inch on integrated circuits had doubled every year since the integrated circuit had been invented. He predicted that this trend will continue in the foreseeable future. After more than 45 years, one can say he predicted correctly since there has been two folds increase in the processing power of computers every year.


It is a common misconception that the economics of data warehousing is possible today because of Moore’s law. It is believed that data warehousing is possible now because everything is less costly because of Moore’s law. But experts believe that the concepts of data warehousing and analytics, and not the economics, is feasible today only because of Moore’s law.


Back in 1990s, when the concept of data warehouses were emerging and being implemented, the data was just terabyte in size. With the increase in processing power, more and more data could be processed and today with the strong buzz about big data, the size of processed data has increased to petabytes. Data warehouses aren’t just bigger than a generation ago; they’re faster, support new data types, serve a wider range of business-critical functions, and are capable of providing actionable insights to anyone in the enterprise at any time or place. All of which makes the modern data warehouse more important than ever to business agility, innovation, and competitive advantage.

Below are some changes in the world of Data Warehouse, Business Intelligence and Big Data in recent times.

    1. Big data analytics in the cloud


     Hadoop, a framework and set of tools for processing very large data sets, was originally designed to work on clusters of physical machines. That has changed. Now an increasing number of technologies are available for processing data in the cloud. Examples include Amazon’s Redshift hosted BI data warehouse, Google’s BigQuery data analytics service, IBM’s Bluemix cloud platform and Amazon’s Kinesis data processing service. The future state of big data could be a hybrid of on-premises and cloud.

     2. Hadoop: The new enterprise data operating system


    Distributed analytic frameworks, such as MapReduce, are evolving into distributed resource managers that are gradually turning Hadoop into a general-purpose data operating system. With these systems enterprises can perform many different data manipulations and analytics operations by plugging them into Hadoop as the distributed file storage system. As SQL, MapReduce, in-memory, stream processing, graph analytics and other types of workloads are able to run on Hadoop with adequate performance, more businesses will use Hadoop as an enterprise data hub. The ability to run many different kinds of queries and data operations against data in Hadoop will make it a low-cost, general-purpose place to put data that enterprises want to be able to analyze.

    3. In-memory analytics


    The use of in-memory databases to speed up analytic processing is increasingly popular and highly beneficial in the right setting. Many businesses are already leveraging hybrid transaction/analytical processing (HTAP) — allowing transactions and analytic processing to reside in the same in-memory database. For systems where the user needs to see the same data in the same way many times during the day — and there’s no significant change in the data — in-memory is a waste of money. And while you can perform analytics faster with HTAP, all of the transactions must reside within the same database. The problem is that most analytics efforts today are about putting transactions from many different systems together. Just putting it all on one database goes back to this disproven belief that if you want to use HTAP for all of your analytics, it requires all of your transactions to be in one place. You still have to integrate diverse data. Moreover, bringing in an in-memory database means there’s another product to manage, secure, and figure out how to integrate and scale.

    To conclude, data warehouses have had staying power because the concept of a central data repository which is fed by dozens or hundreds of databases, applications, and other source systems. It continues to be the best, most efficient way for companies to get an enterprise-wide view of their customers, supply chains, sales and operations. For this reason, businesses that have data warehouses are  upgrading and augmenting them with technologies such as Hadoop and in-memory processing, which help the 'big data' workloads that are much more bigger than before.

    Thursday, March 5, 2015

    Data Presentation and Visualization Methods


    Data Visualization

    Data visualization is a general term used to describe any technology that lets corporate executives and other end users “see” data in order to help them better understand the information and put it in a business context. It is used to communicate data or information by encoding it as visual objects (e.g., points, lines or bars) contained in graphics.

    Business Vignettes and Methods of Presentation 

    Human Resource Management 

    Human resource management include data management of employment related actions such as recruitment, promotion, classification, compensation, performance, training, etc. Some important metrics related to human resource management are headcount of employees in each department, number of employees in the company by year, number of employees by salary, payroll breakdown in various departments, etc. To represent these metrics some of the common presentation methods are horizontal and vertical bar charts, pie charts, doughnut charts, line charts, etc.
    To represent human resource (HR) data, bar charts seem the most appropriate to me. This is because HR data can mostly be represented along two axes. For example, data can be plotted against number-year, cost-year, department-number, etc. Visualization using bar charts looks simple and clean, yet informative.

    Bar chart showing HR data


    Financial Services: Banking 

    Banks have access to more customer information than businesses in any other sector, and it is vital to effectively leverage information assets. Currently, transactional data remains one of the keys areas of focus for financial institutions. Analyzing transactions can uncover powerful insights into customer needs, preferences and behaviors. Transaction data can be represented by a number of different charts since each time it may have different attributes to represent. For example, while representing number of transactions across different credit institutions, we can use the simple bar chart. Whereas, to represent complex data such as detailed transactional activities across amount and time, we may use something as complex as an area chart.

    To ease visualization, I believe it is better to show information in multiple charts instead of cramming all information into one chart. A combination of pie chart, stacked charts and line charts can be used to analyze different transactions across different attributes. These chart types are simple and easy to understand rather than complex charts like area charts.

    Pie charts and Stacked charts showing transactional data in Banking domain


    Transportation 

    To keep up with the demands of the information age, transportation firms must do more than simply move passengers or shipments from point A to point B on time. Customers demand constant real-time visibility and increased self-service. Employees must provide just-in-time service via a combination of traditional tools and mobile devices. Managers need the business insight to optimize schedules and routes, hedge fuel costs, create the right marketing offers, set competitive fares and rates, and identify and retain top employees.
    Based on the type of data being shown, we can use various type of charts in the transportation domain. This may include bar chart, pie chart, heat maps, bubble chart, line chart, doughnut chart and other geographical maps.
    In my opinion, it all depends on the type of transportation data that you want to show. Depending on the need, one can choose from bubble chart, heat maps and geographical maps. For example, if we want to see which city has the most number of public transportation routes available, we might choose a bubble chart. But if we want to view traffic distribution across different areas, we may use geographical maps.

    Transportation data on geographic map with numbers
    Bubble chart showing transportation data in different cities
    Sources:
    Wikipedia
    Google images

    Thursday, February 19, 2015

    Big Unstructured Data v/s Structured Relational Data


    Big data has opened doors never before considered by many businesses. The idea of utilizing unstructured data for analysis has in the past been far too expensive for most companies to consider. Thanks to technologies such as Hadoop, unstructured data analysis is becoming more common in the business world.

    Business owners may be wondering if the current use of data warehousing could give them insights as versatile as big data. To understand the current scenario and future possibilities lets starts with understanding the difference between structured and unstructured data.

    Structured Data


    Data that resides in a fixed field within a record or file is called structured data. This includes data contained in relational databases and spreadsheets. Although data in XML files are not fixed in location like traditional database records, they are nevertheless structured, because the data are tagged and can be accurately identified. Structured data first depends on creating a data model – a model of the types of business data that will be recorded and how they will be stored, processed and accessed. This includes defining what fields of data will be stored and how that data will be stored: data type (numeric, currency, alphabetic, name, date, address) and any restrictions on the data input. Structured data has the advantage of being easily entered, stored, queried and analyzed. 


    Unstructured Data

    Unstructured data refers to information that either does not have a pre-defined data model or is not organized in a pre-defined manner. This results in irregularities and ambiguities that make it difficult to understand using traditional computer programs as compared to data stored in fielded form in databases or annotated in documents. Some examples of unstructured data are photos and graphic images, videos, streaming instrument data, webpages, pdf files, PowerPoint presentations, emails, blog entries, wikis and word processing documents.

    Present state of data
    Today, multinational companies and large organizations have operations in places that are scattered around the world. Each place of operations may generate large amount of both structured and unstructured type of data. They need very rapid access to more insights and they cannot afford to wait—else they lose a competitive edge. For IT organizations, this means delivery of relevant, timely insights faster than ever before. Thus, data creation, storage, retrieval and analysis varies in terms of volume, variety and velocity.
    Volume:
    Many factors contribute to the increase in data volume. Transaction-based data stored through the years. Unstructured data streaming in from social media. Increasing amounts of sensor and machine-to-machine data being collected. In the past, excessive data volume was a storage issue. But with decreasing storage costs, organizations store any and all data that may seem relevant at the moment. For example, insurance companies may have data from thousands of local and external branches, large retail chains have data from hundreds or thousands of stores and so on. Corporate decision makers require access of information from all such sources. But it is not so simple because it is not easy to understand and use this huge volume of data.
    Variety:
    Today data isn't just numbers, dates, and strings. It is also geospatial data, 3D data, audio and video, and unstructured text, including log files and social media. Traditional database systems were designed to address smaller volumes of structured data, fewer updates or a predictable, consistent data structure. As applications have evolved to serve large volumes of users, and as application development practices have become agile, the traditional use of the relational database has become a liability for many companies rather than an enabling factor in their business.
    Velocity: Data is streaming in at unprecedented speed and must be dealt with in a timely manner. RFID tags, sensors and smart metering are driving the need to deal with torrents of data in near-real time. Reacting quickly enough to deal with data velocity is a challenge for most organizations.

    Data Warehouse


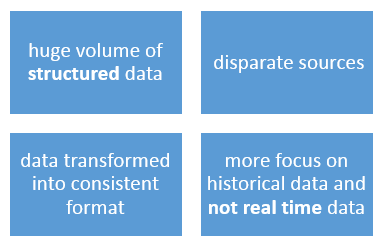
    Data warehouse is defined as a subject-oriented, integrated, time-variant, and nonvolatile collection of data in support of management's decision-making process. In this definition the data is:
    • Subject-oriented as the warehouse is organized around the major subjects of the enterprise (such as customers, products, and sales) rather than major application areas (such as customer invoicing, stock control, and product sales). Date warehouse is designed to support decision making rather than application oriented data.
    • Integrated because of the coming together of source data from different enterprise-wide applications systems. The source data is often inconsistent using, for example, different formats. The integrated data source must be made consistent to present a unified view of the data to the users.
    • Time-variant because data in the warehouse is only accurate and valid at some point in· time or over some time interval.
    • Non-volatile as the data is not updated in real time but is refreshed from on a regular basis from different data sources. New data is always added as a supplement to the database, rather than a replacement. The database continually absorbs this new data, incrementally integrating it with the previous data.

    Interesting things to note from the definition are:


    Limitations of Data Warehouse from data perspective

    While data warehouse works perfectly with structured data, it is far from handling unstructured data such as images, videos, emails, webpages, etc. Some of the data comes in forms of Excel spreadsheets or PowerPoint presentations. There is no easy way to get access to the data and it requires intensive manual processing to gather the data and create reports. Also, with the excitement about big data in the market, when organizations are leaving no stone unturned to gain even a tiny portion of competitive edge, data warehousing is at a disadvantage.

    Furthermore, data is hosted on various systems which make silos of information. Fulfilling warehouse with data requires extracting, transforming and loading - processes which are quite time consuming. Thus, a data warehouse is not suitable to process real time instantaneous data.

    Other Limitations

    One of the problem with data warehouses is their cost. Like all advanced technology, when data warehouses were first introduced, only the truly wealthy companies could afford them. Even today, most data warehouses are outside the price range of many companies. While vendors in recent years have begun tailoring their products towards small to medium sized businesses, many of these companies may not see the need of using a system that is overly complex. 
    Another problem is that in the past, it wasn’t uncommon for a data warehouse project to take many months for implementation. Most firms today want results, and they want them fast. They don’t see the need for waiting months on a system and it will take time before a company begins seeing a return on their investment. Many firms simply don’t have the patience to wait for these returns. 

    Future of Data warehouse

    Automation

    Data warehouses is facing strong competition from the rising “data lake” architecture based on Hadoop. Data lakes provide cost savings on software and storage. Newer organizations are adopting this strategy for economic reasons. However, data lakes specifically and Hadoop in general has the downside of “time to implementation”. Data warehouse will face huge changes from the world of data warehouse automation. Just like we no longer hand code ETL scripts, we can see productization of data modeling and database administration to speed up time to implementation in the future, increase efficiency and optimize use of resources. 

    Data warehouse with real time dashboards

    Today’s data warehouses are not moving at the speed of the business. It takes forever to integrate a new data source into your data warehouse. You have to figure out what reports you’re going to want so you can pre-define data dimensions for aggregation. You have to figure out a schema that can accommodate all the data you’re going to include. You have to set up ETL to translate your operational data into that analytic schema, and you have to maintain separate technology stacks at the operational, analytic, and archive tiers. This kind of traditional data warehouse is resistant to change. The trend is moving towards operationalizing the data from the data warehouse. This means building data services that can combine data from multiple sources and provide that data securely and performant to an operational process so that process can complete in real time. Fraud detection, eligibility for benefits, and customer onboarding are all examples of use cases that used to be performed offline but now need to be performed online in real-time.

    References
    http://www.webopedia.com
    http://www.pcmag.com/encyclopedia
    http://en.wikipedia.org
    http://ecomputernotes.com
    http://www.exforsys.com/tutorials/data-warehousing
    http://www.bisoftwareinsight.com

    Monday, February 2, 2015

    Blog Assignment #1

    Business Intelligence & Analysis Products

    Businesses today have access to more data than ever. But collecting and analyzing that data and turning it into useful information is a big challenge. Today, many Business Intelligence tools are capable of handling large amounts of unstructured data to help identify, develop and create new strategic business opportunities.

    Following are five Business Intelligence & Analysis products.

    Features:            
    1.      Web & Mobile Authoring:  Web & mobile authoring offers some of Tableau's most valuable analytical features. This means that you're able to edit the view in any browser, including on a mobile device. It includes the ability to show and hide quick filters, so you can slice your data. These analytical functions can help you get to answers in your data while you're on the go.
    2.      Dashboards: Tableau hosts variety of new features including the ability to overlap objects on a dashboard. This provides far more flexibility in how authors can present information and should allow for compelling designs. It even allows floating objects. You can add hyperlinks to captions, titles, and dashboard text objects simply by typing the link. Reaching out to external information can be an excellent way to extend an analysis.
    3.      Forecasting: Tableau provides built-in statistical models to forecast your data including models that account for seasonality and trends.
    4.      Data: Tableau supports a native connector to Salesforce®, force.com®, and database.com®. It also offers a direct connector to Google BigQuery, Google’s technology for fast, interactive analysis of massive data. This integration allows anyone to quickly analyze massive amounts of data using simple drag-and-drop operations, i.e. no coding necessary.
    5.      Business Integration: Developers creating web applications can integrate fully interactive Tableau content into their applications via the new JavaScript API. The API provides a tremendous range of interactivity in the Tableau view. This enables you to provide a high level of interactivity between a Tableau visualization and the rest of the web page.
                                          

    Features:
    1.      Self-service and Visualization: Empower users with a complete self-service business intelligence (BI) solution delivered through Excel and Power BI for Office 365.  Its Mobile BI access to reports in Power BI for Office 365 is provided through new HTML5 support and a native mobile application for Windows 8 tablets.
    2.      Dashboards & Reporting: SharePoint Server provides a full set of rich dashboard and scorecard capabilities including advanced filtering, guided navigation, interactive analytics, and visualizations. It even helps you Scale your environment from a few reports to a corporate-wide deployment. SQL Server Reporting Services is a comprehensive, highly scalable solution providing operational reporting for browser-based viewing, as well as ad-hoc data exploration and visualization.
    3.      Analysis: SQL Server Analysis Services empowers you to build comprehensive, enterprise-scale analytic solutions that leverage in-memory technology and provide interactive exploration of aggregated data. The Services platform builds high performance analytical models (multidimensional and tabular) that can be used for interactive data analysis, reporting, and visualization.
    4.      Predictive analytics: SQL Server predictive analytics perform insightful analysis by including data-mining results as dimensions in your Analysis Services cubes. It adds prediction functions to calculations and key performance indicators. It natively integrates reporting by using data-mining queries as the source in Reporting Services.


    Features:                                                    
    1.      OLAP Analytics: The industry-leading multi-dimensional online analytical processing (OLAP) server is designed to help business users forecast likely business performance levels and deliver "what-if" analyses for varying conditions. It supports analysis and reporting for a thousands of users with access to very large data sets and rapidly discover and highlight trends in these very large data sets
    2.      Scorecard and Strategy Management: Define strategic goals and objectives that can be cascaded to every level of the enterprise, enabling employees to understand their impact on achieving success and align their actions accordingly.
    3.      Mobile BI: The Oracle Business Intelligence (BI) Mobile portfolio brings data driven, analytic insights to smartphones and tablets without compromising data integrity or security.
    4.      Enterprise Reporting: Provides a single, Web-based platform for authoring, managing, and delivering interactive reports, dashboards, and all types of highly formatted documents.


    Features:                                                
    1.      Analytics: MicroStrategy supports a full range of analytic functionality, from stunning business dashboards to sophisticated statistical analysis and data mining. Its platform gives you the flexibility to start small and seamlessly scale to an enterprise deployment.
    2.      Dashboards: MicroStrategy is the only platform that combines the analytics and interactivity of Dashboards with the immediacy of real-time operational dashboards, ensuring that decision-makers can spot, analyze, and react to quickly changing trends and outliers.
    3.      Reporting: MicroStrategy includes the world’s best enterprise reporting, so users can securely deliver pixel-perfect, boardroom quality reports and statements to any number of internal users, partners, or customers. It offers automated document distribution, along with subscription to reports so that you always have the most up to date information.
    4.      Mobility: MicroStrategy effortlessly supports the distribution and consumption of analytics across all major media. Any report or dashboard can instantly be viewed anywhere, with no loss of formatting or functionality.


    Features:                                                                         
    1.      Analysis: IBM Cognos offers flexible solutions with guided report analysis, dashboards, navigable reports and mobile business intelligence. It explores data and track business developments with capabilities for tracking patterns and adding them to your charts and graphs. It also uncovers patterns in your business and apply algorithms to business intelligence data to predict outcomes.
    2.      Reports: IBM Cognos includes capabilities for authoring, viewing and modifying reports and interactive visualizations—online or off, in Microsoft Office applications or in-process applications, in the office or on the go.
    3.      Dashboards: IBM includes dashboards that you can view, interact with and personalize in ways that support the unique way you analyze data and make decisions. Historical information alongside current data, data in motion and predictive analytics help you quickly move from insight to decision—all in one dashboard.
    4.      Mobile Apps: With IBM business intelligence mobile apps for Apple iPhone and iPad and Android tablets and smartphones, you can interact with reports, analysis, dashboards and more on your mobile device of choice.
    5.      Real-time monitoring: IBM Cognos includes a real-time monitoring capability that makes it possible for you to view your operations data in motion. It features self-service, interactive dashboards with current operational KPIs and measures for frontline business users, including executives on the go, managers and analysts, who need to react quickly to performance improvement opportunities.

    To summarize, following is criteria analysis for the products discussed above:
    Criteria
    Weight
    Tableau
    Microsoft BI
    Oracle BI
    Microstrategy
    IBM Cognos
    Reporting Features
    30%
    5
    8
    6
    7
    6
    Analysis Features
    30%
    6
    8
    8
    7
    7
    Dashboard & Mobility
    20%
    9
    5
    7
    6
    5
    Integration
    10%
    9
    5
    6
    8
    5
    Cost
    10%
    3
    8
    6
    4
    7
    Total Points
    100%
    6.3
    7.1
    6.8
    6.6
    6.1
    Rank

    4
    1
    2
    3
    5

    What these criteria mean:
    ·         Reporting & Analysis Features: This indicates the strength of analytic and reporting capability the tool provides.
    ·         Dashboard & Mobility: This indicates the flexibility and ease of use of dashboard the tool provides. Mobility indicates how easily the tool interacts with mobile devices.
    ·         Integration: It indicates the variety of databases the tool can connect with. The higher this number, the more versatile the tool is.
    ·         Cost: This reflects the cost per user of a licensed version of the tool.

    What these ratings mean for the products:
    Microsoft BI: It is better for large enterprise-wide deployments with pre-existing investments in SQL Server and Office. Organizations using a different RDBMS will have a steeper learning curve. Therefore it scored low in the Integration criteria. Its dashboard capabilities are limited and it is also not as flexible with mobile devices as the other tools. Hence it scored low in the dashboard & mobility criteria. But it is inexpensive and has strong reporting and analytical capabilities.

    Oracle BI: Its reporting platform has great tools for building reports and dashboards. Its analysis features have a strong market presence. However, it ranks moderately with dashboard, mobility and integration capabilities.

    MicroStrategy: It is very well suited for small and large companies and for varying degrees of budgets. Its reporting, analysis, dashboard and mobility capabilities are somewhat moderate as compared to the other tools.

    Tableau: It is useful for those who want to build real time visualizations on the run, with little technical expertise. Since it provides variety of dashboard functionalities and supports various databases, it scored high in those criteria. But it lacks strong reporting and analysis features and is expensive too.

    IBM Cognos: It is great at consistently delivering static historical reports to users across the enterprise. It connects well to the majority of enterprise data storage systems. However, it is a difficult tool to use that requires a specialized set of skills in order to be productive, hence the lowest rank.